Reflections • Research Practice • Remote Sensing • Field Ecology
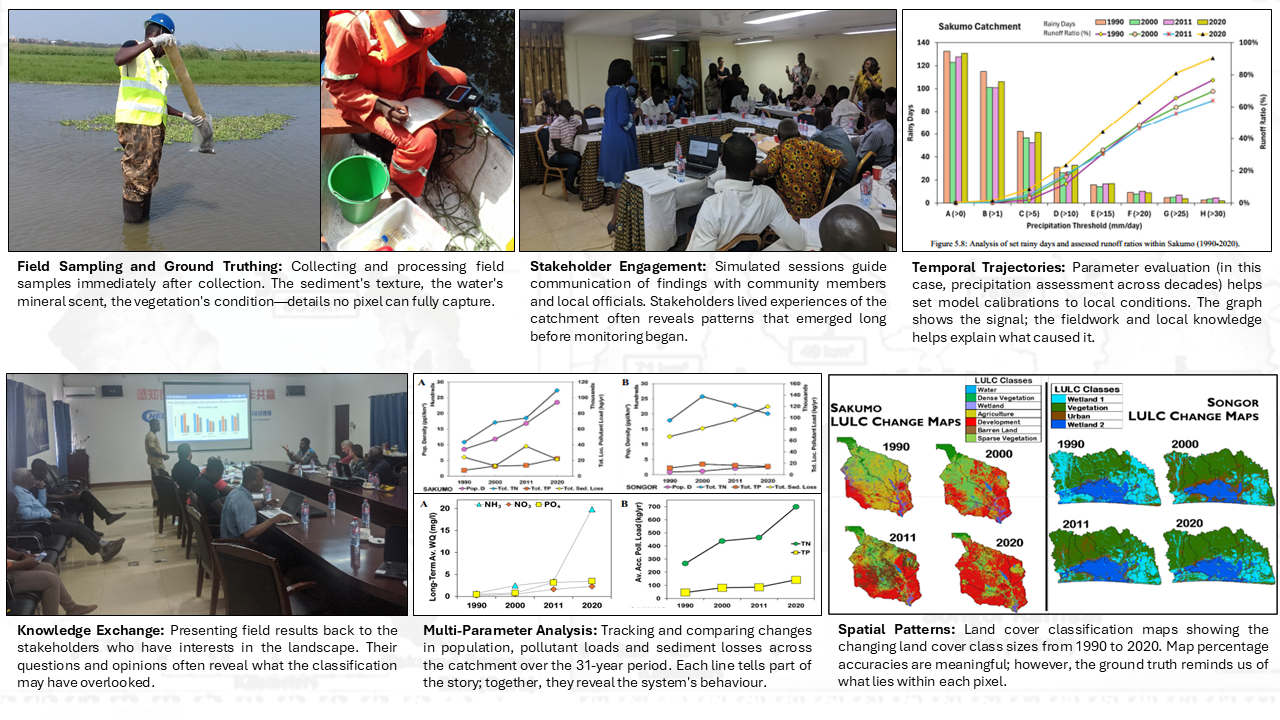
From field transects to satellite pixels: different scales of observation, the same landscape. The interesting work happens when I move between the two.
I still remember what the Sakumo and Songor catchments smell like.
The sharp mineral scent of hypersaline water at low tide. The weight of wet sediment pulling against every step. The conversations with fishermen and salt workers who could describe changes in the landscape long before I ever opened a satellite image.
There are things you notice when you are standing inside an ecosystem that no satellite can quite give you.
You notice the texture of the sediment beneath your feet. The condition of the vegetation. The smell of the water. The activity around you. Sometimes, you notice that something feels different before you can explain exactly what has changed.
At some point, though, I stopped measuring ecosystems primarily from the ground and started interpreting them through pixels.
I didn't think much of that transition at first. It felt like a change in tools. Learn the software. Process the imagery. Build the classification. Assess the accuracy. Produce the map.
Looking back, it was much more significant than that.
I was changing not only how I measured the environment, but the scale at which I could think about it.
The Landscape Looked Different from Space
My early work was rooted in coastal field ecology along Ghana's shoreline. Transects, sediment sampling, landing site surveys and ecological observations formed much of how I learned to understand environmental change.
Everything happened at human scale.
You went to a location. You observed what was there. You measured it. You talked to people who knew the area. Then you moved to the next site.
There was something grounding about that way of working. The ecosystem wasn't an abstract study area. It was a place you could walk through.
Then I began working more extensively with satellite imagery.
Suddenly, I could look at an entire catchment at once. I could compare locations I had never physically visited. More importantly, I could go backwards in time and ask how the landscape had changed before I had ever started studying it.
The Landsat archive made that particularly powerful. Decades of observations meant that environmental change was no longer something I had to reconstruct entirely from what I could see today. There was a historical record sitting above us, waiting to be interpreted.
The biggest change wasn't the technology. It was the scale at which I learned to think.
Two Ways of Seeing the Same Landscape
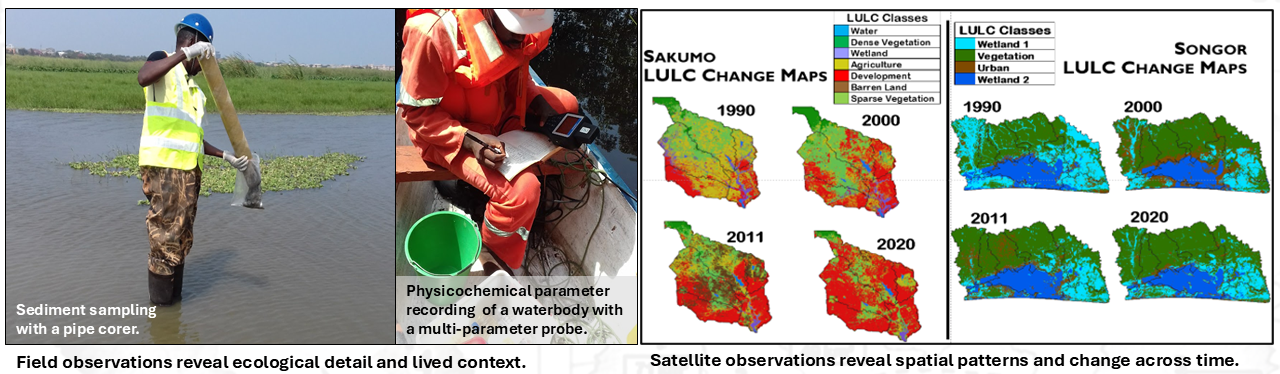
Field observations reveal ecological detail and lived context. Satellite observations reveal spatial patterns and change across time.
Neither view is the landscape itself.
Each is a way of observing it.
What I Still Look for on the Ground
Working with remote sensing for years has not made me less interested in fieldwork.
If anything, it has made me more aware of what I lose when I am not there.
A field visit forces you to slow down. You start noticing relationships that are difficult to represent in a raster layer.
Why is vegetation healthier in one part of a wetland than another? Why does the sediment look different here? What is happening around the water's edge? What do people who use the area every day know that isn't written in any dataset?
These observations matter because environmental patterns rarely explain themselves.
An NDVI decline is a signal. It tells me that something has changed in the vegetation response being measured.
It does not, by itself, tell me whether the cause is drought, salinity, land conversion, disturbance or something I hadn't considered.
That distinction has become increasingly important to me.
The more sophisticated our datasets become, the easier it is to forget that a signal still needs interpretation.
What the Pixels Gave Me
If fieldwork gave me depth, remote sensing gave me perspective.
Instead of observing a handful of locations, I could examine an entire catchment.
Instead of asking what was happening today, I could ask what had been happening over decades.
Instead of treating each observation as an isolated point, I could begin looking for relationships across space.
- Spatial scale: seeing patterns across entire landscapes rather than individual sampling locations.
- Temporal scale: examining trajectories that would be impossible to reconstruct from a single field campaign.
- Historical context: asking what the landscape looked like before a research project ever began.
That changed the questions I could ask.
I could move from asking what was happening at a particular site to asking how an entire catchment was changing, where that change was concentrated, and how different parts of the landscape were responding to the same pressures.
Some patterns simply do not exist at field scale.
You have to step back far enough to see them.
But a Map Can Be Convincing for the Wrong Reasons
There was another lesson I had to learn.
Maps are persuasive.
Give me a well-designed classification with clean boundaries, a legend and an accuracy figure, and it can feel much more certain than the underlying landscape actually is.
That confidence can be dangerous.
A 30-metre Landsat pixel is not a tiny photograph of a single, perfectly defined piece of land. It is a measurement representing an area of the Earth's surface, and that area can contain multiple land-cover conditions and processes.
The landscape does not care where I draw my classification boundaries.
It doesn't suddenly become "built-up" at one pixel edge and "wetland" at the next because my legend says so.
And an overall classification accuracy above 90% does not mean that 90% of reality has been captured perfectly.
It means something much more specific about agreement between the mapped result and the reference data used to assess it.
Landscape heterogeneity, class characteristics and the quality and design of reference data all influence what those numbers actually mean.
That realisation made me more interested in what a map could tell me, but also more careful about what it could not.
The Questions Changed With the Scale
The most important change was not that I moved from fieldwork to remote sensing.
It was that the questions began to change with the scale of observation.
At field scale, I could ask:
What is happening here?
At catchment scale, I could begin asking:
Where is change occurring, how extensive is it, and how has it evolved through time?
Those are different questions.
Neither is inherently better.
But the answer to one does not automatically answer the other.
That is probably the most important lesson I have carried from moving between field ecology and geospatial analysis.
Changing the way you observe a system changes the questions you are able to ask about it.
Coming Back to the Same Landscape
I don't think of field observations and satellite observations as competing ways of doing environmental science anymore.
I think of them as different perspectives on the same system.
The field reminds me that every pixel represents a real place, with processes, people and ecological relationships that are more complicated than any classification scheme.
The satellite reminds me that those individual observations are part of something much larger, and that some of the most important patterns only become visible when we step back.
One gives me context.
The other gives me perspective.
The interesting work happens when I move between the two.
Looking Ahead
This way of thinking has gradually influenced how I approach environmental research more broadly.
I'm increasingly interested in combining field observations, Earth observation, hydrological modelling and newer computational approaches to understand not just where environmental change is occurring, but what that change means.
Because a map can show us where a wetland has contracted.
A time series can show us when the decline began.
A model can help us explore what might happen next.
But somewhere between those steps, we still have to understand what we are looking at.
That is where I think environmental intelligence begins: not with having more data, but with learning how to see the system clearly enough to ask better questions of it.
And once we start asking better questions, another problem becomes harder to ignore:
What does it cost when we get the interpretation wrong?