Coastal Wetland Monitoring for Sustainable Development
A 30-year geospatial analysis revealing structured wetland loss and anthropogenic transformation across two Ramsar coastal catchments in Ghana.
LULC Change Analysis • Remote Sensing • Environmental Intelligence
Project Snapshot
Between 1970 and 2015, the world lost roughly 35% of its coastal wetlands, driven by urbanisation, industrialisation, and climate pressures.
This project demonstrates how multi-decadal satellite observation combined with geospatial analysis can diagnose ecosystem transformation in vulnerable coastal landscapes.
Two Ramsar-designated wetlands in Ghana were analysed:
- Sakumo Catchment
- Songor Catchment
Using 30 years of satellite data (1990–2020), the study quantified land-use transitions, ecosystem restructuring, and socio-environmental drivers of wetland degradation.
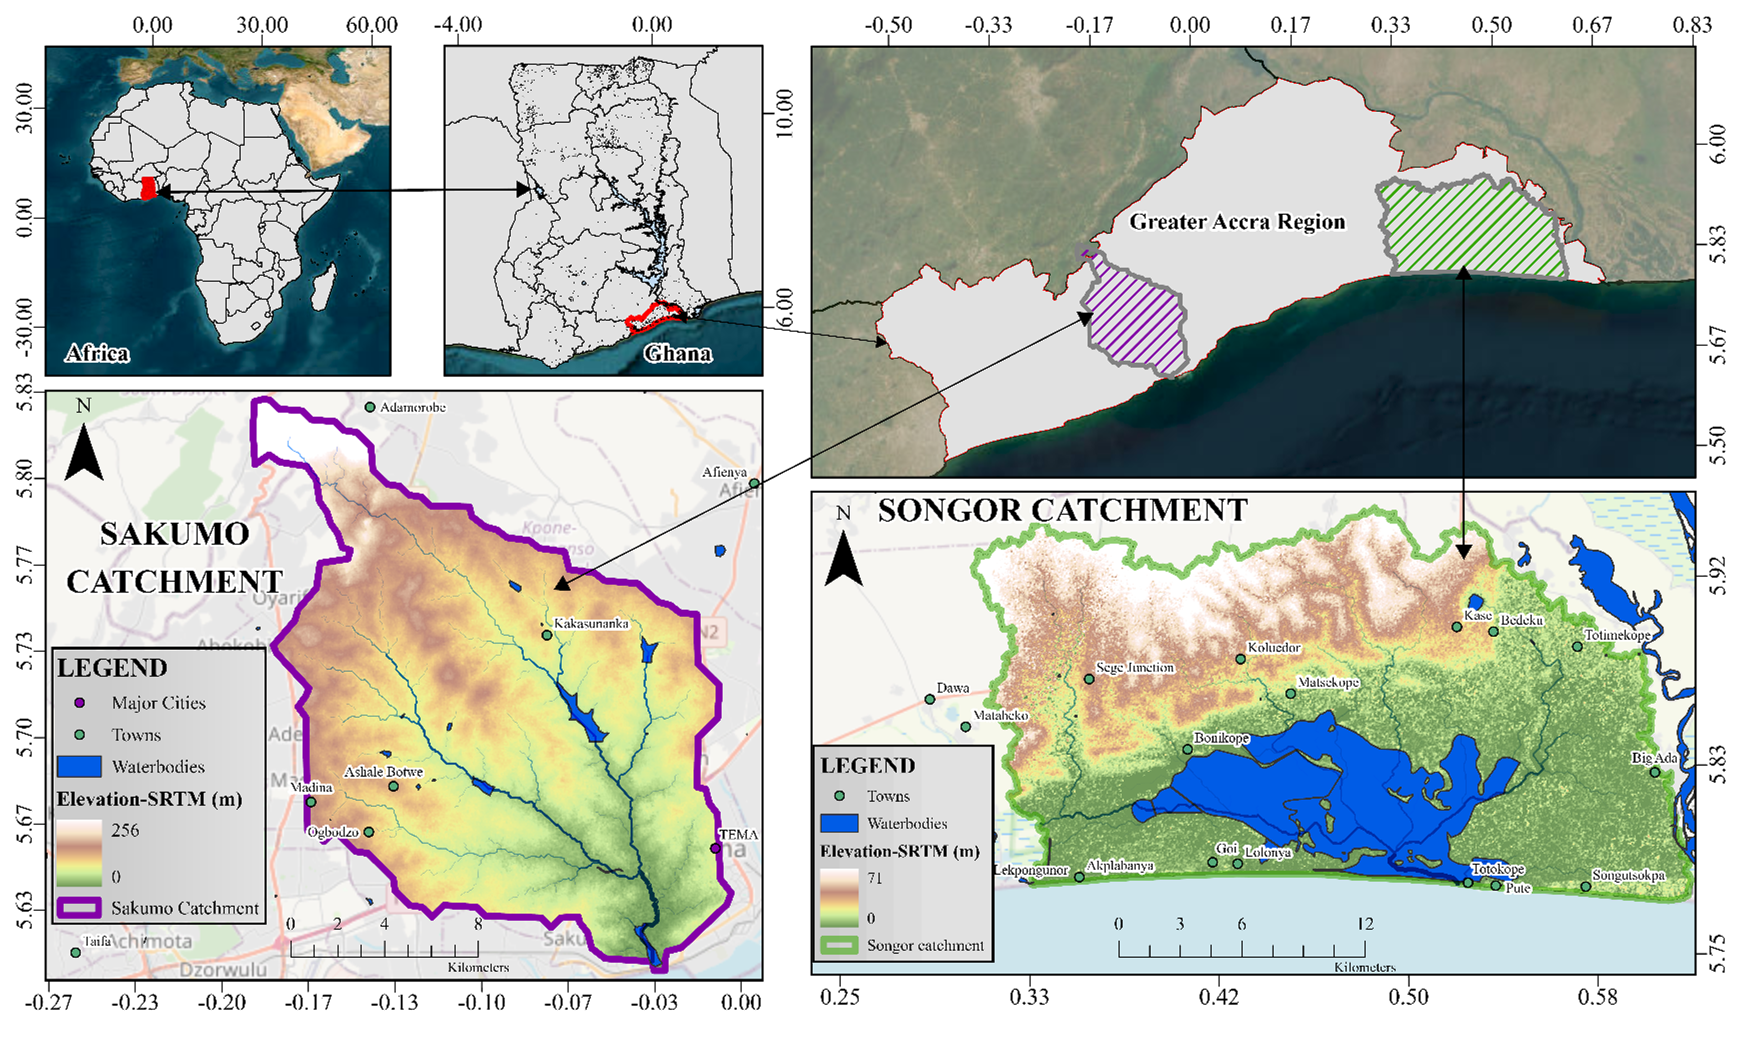
Study area and hydrological context of the Sakumo and Songor Ramsar catchments, Ghana.
Catchment boundaries derived from the Shuttle Radar Topography Mission (SRTM) Digital Elevation Model define the contributing drainage areas to each lagoon system. These hydrological units form the spatial framework for all land-use change analysis and environmental driver assessments conducted between 1990 and 2020.
Project Quick Facts
- Study Period
1990 – 2020 - Study Sites
Sakumo & Songor Ramsar Sites - Primary Data
Landsat Series - Climate Data
CHIRPS, TerraClimate - Population Data
Ghana Population Census, LandScan, WorldPop, GlobPOP - Classification Accuracy
72% – 77% - Core Methods
Intensity Analysis
Supervised Classification
Mann–Kendall Trend Analysis
Project Objectives
The analysis aimed to diagnose how wetland landscapes restructure under human and climatic pressures.
- Quantifying LULC transitions from 1990–2020
- Determining change intensity patterns
- Identifying primary environmental and socio-economic drivers
Datasets and Analytical Contributions
Abbreviations: USGS – United States Geological Survey; SRTM – Shuttle Radar Topography Mission; CHIRPS – Climate Hazards Group InfraRed Precipitation with Station Data; TerraClimate – Global climate dataset; LandScan – Population distribution dataset; WorldPop – High-resolution global population dataset; GlobPOP – Gridded global population dataset.
Pre-processing steps included:
- Atmospheric correction using Dark Object Subtraction
- Vegetation detection using NDVI
- Water extraction using MNDWI
Analytical Workflow

Multi-stage remote sensing workflow used to quantify land-use and land-cover (LULC) dynamics across the Sakumo and Songor catchments.
The analytical pipeline integrates Landsat image preprocessing, supervised classification, accuracy assessment, and post-classification change detection. The workflow culminates in intensity analysis and driver attribution to diagnose the processes governing landscape transformation over the 30-year study period.
Classification Benchmarking
| Classifier | Sakumo Catchment | Songor Catchment | ||
|---|---|---|---|---|
| Accuracy | Kappa | Accuracy | Kappa | |
| K-Nearest Neighbour | 66% | 0.55 | 65% | 0.56 |
| Random Trees | 60% | 0.45 | 62% | 0.52 |
| Maximum Likelihood | 72% | 0.63 | 77% | 0.70 |
| Support Vector Machine | 67% | 0.55 | 59% | 0.48 |
The Maximum Likelihood classifier produced the highest reliability and was selected for final mapping.
Intensity Analysis Framework
Traditional change detection only reports net gains and losses. Intensity analysis reveals whether landscape transitions occur systematically or randomly.
- Identifies disproportionate land transitions
- Detects acceleration of landscape change
- Distinguishes systematic vs random change
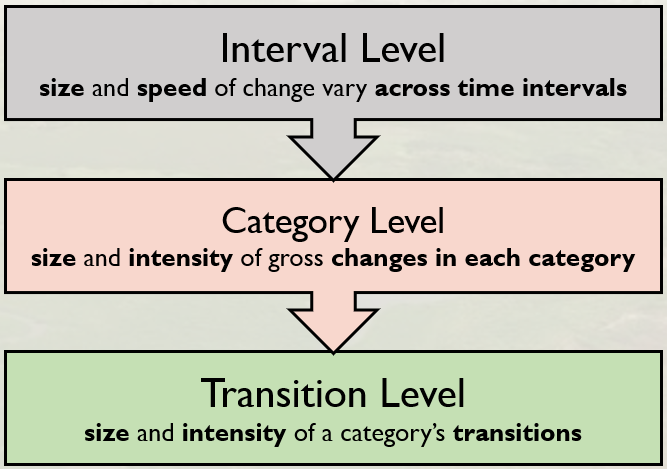
Intensity analysis framework used to diagnose systematic versus random land-cover transitions.
The three-level structure evaluates landscape change at the interval, category, and transition levels, allowing identification of disproportionately active land conversions. This framework reveals whether wetland losses occur randomly or reflect structured transformations driven by human land-use pressures.
Spatial Change Visualisation
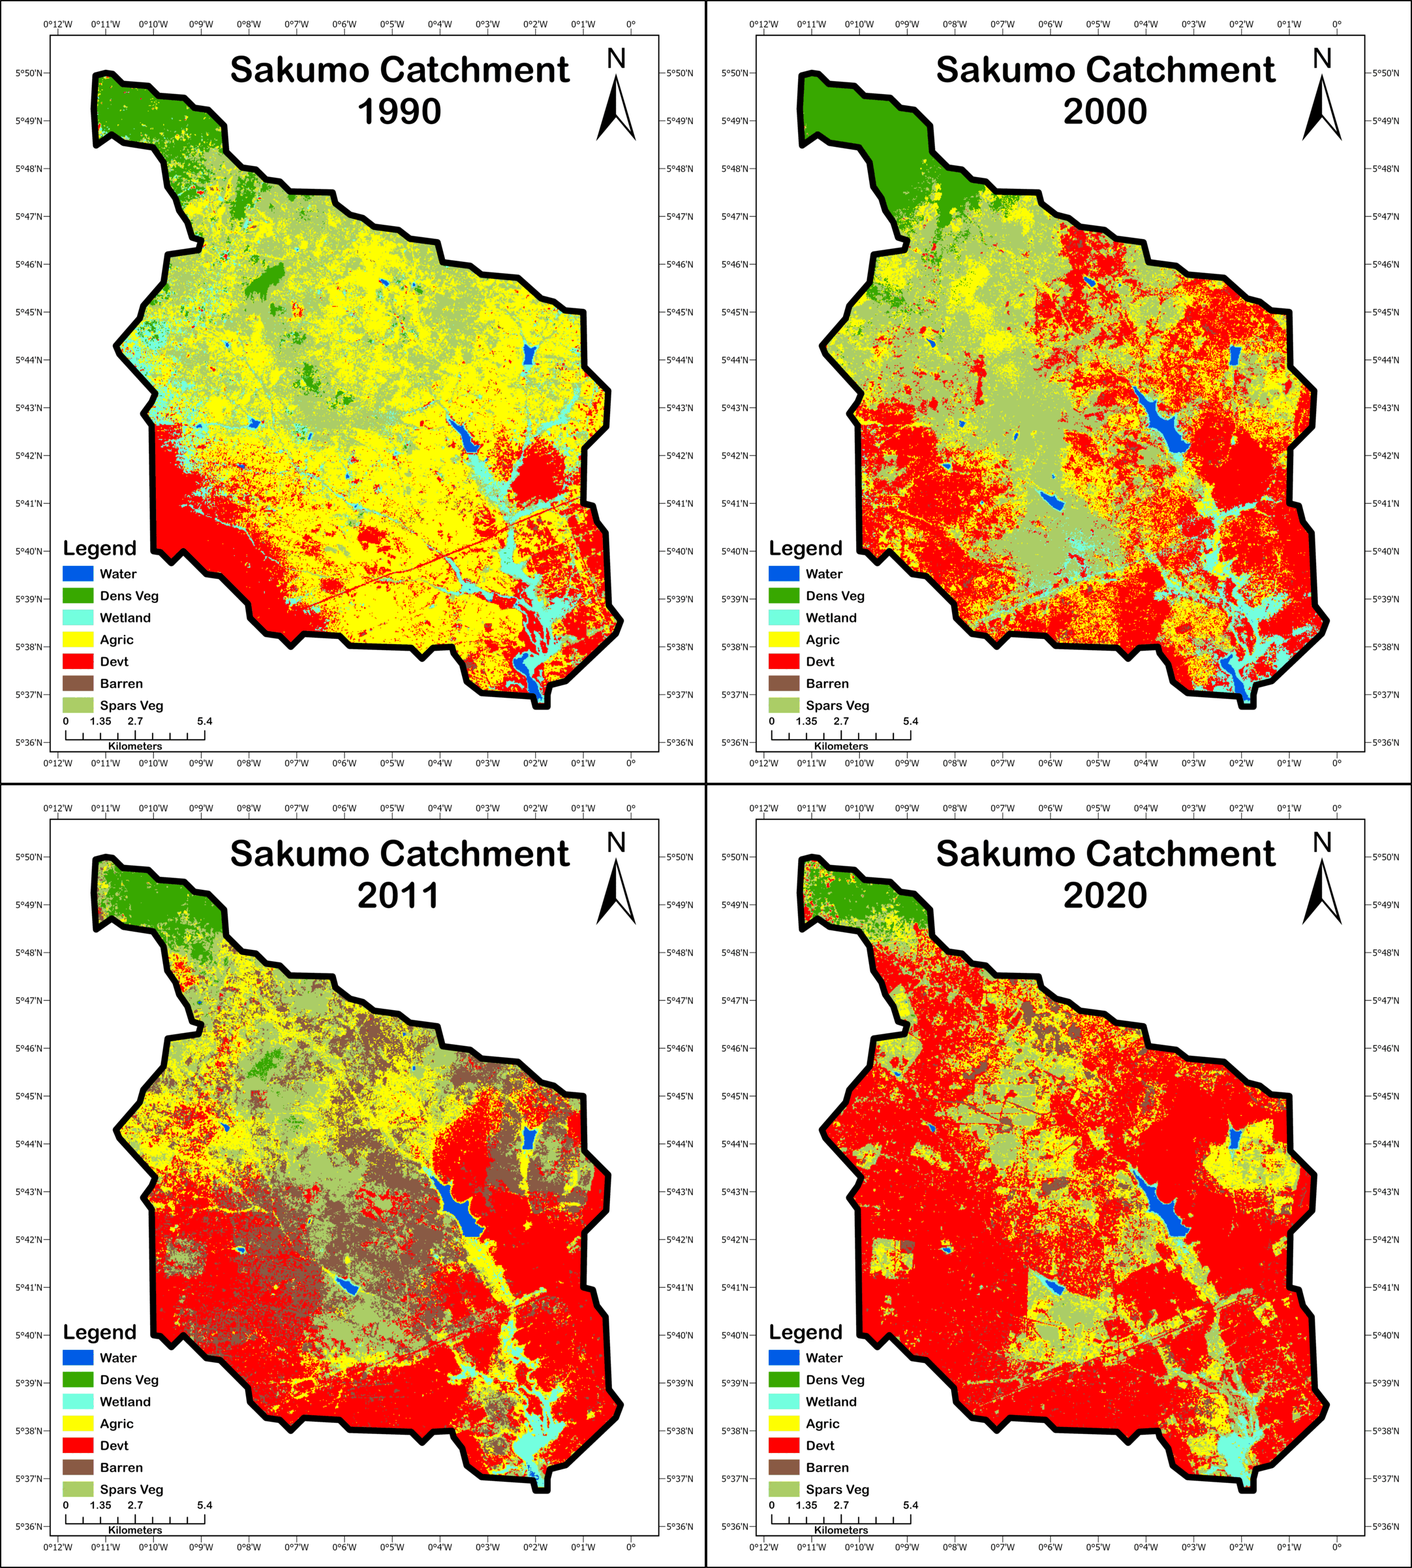
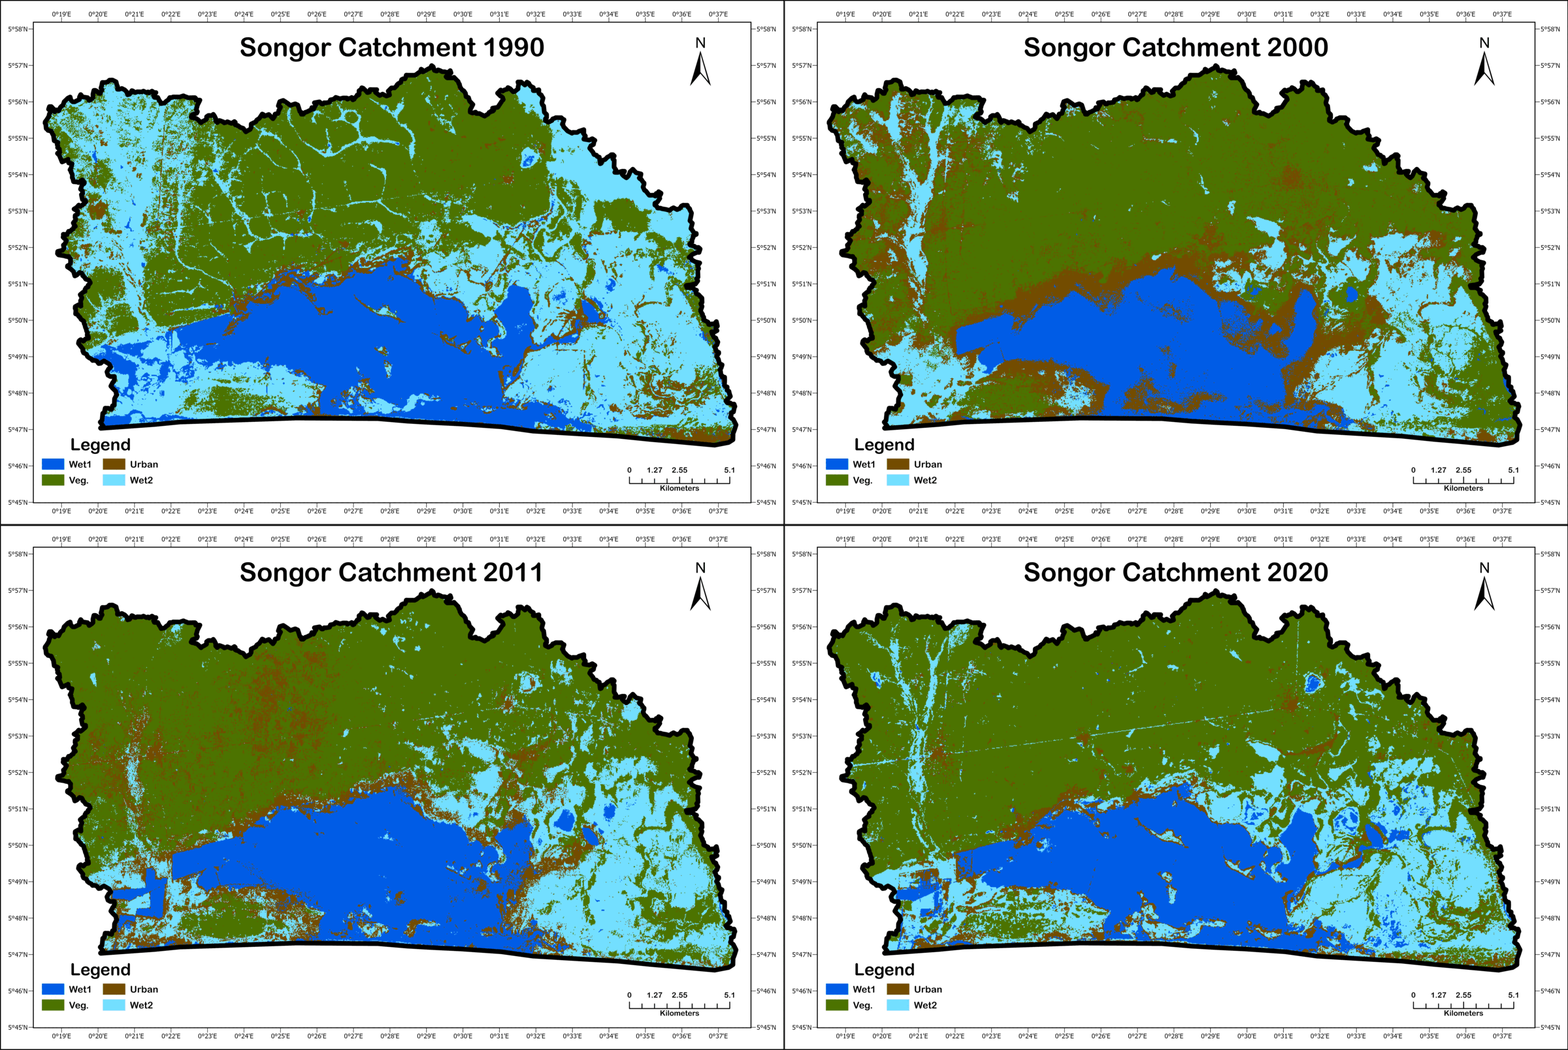
Multi-temporal land-use and land-cover evolution across the Sakumo (left) and Songor (right) catchments between 1990 and 2020.
Sequential Landsat classifications reveal progressive expansion of built-up and agricultural land at the expense of wetlands and natural vegetation. The animations highlight spatial clustering of land transformation along lagoon margins and urban growth corridors, illustrating the structural reconfiguration of coastal wetland landscapes over three decades.
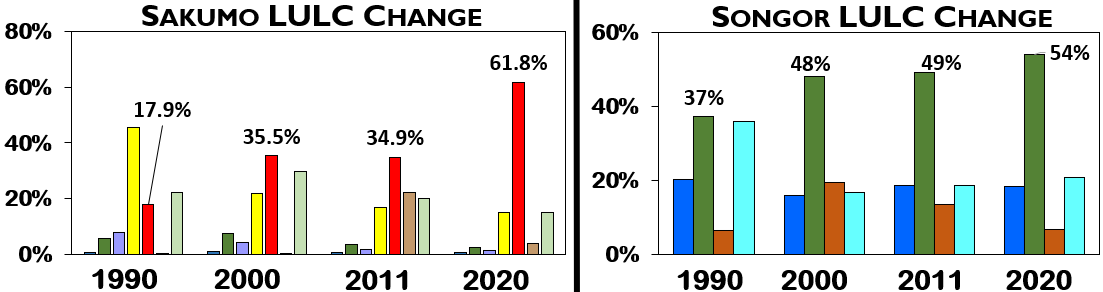
Quantitative land-use transition statistics for the Sakumo and Songor catchments (1990–2020).
Class-level area changes highlight significant reductions in wetland and vegetated land cover alongside rapid expansion of built-up surfaces. These results confirm a persistent anthropogenic transformation trend within the coastal catchments.
Catchment Boundaries
The Sakumo and Songor lagoons are embedded within coastal drainage basins that define the hydrological limits of surrounding land use interactions. These catchment boundaries were used to spatially constrain the analysis of land use and land cover change.
A Digital Elevation Model (SRTM) was used to derive terrain structure and delineate the hydrological catchments draining into each lagoon. These boundaries provide the spatial framework for analysing land transformation within the contributing landscape.
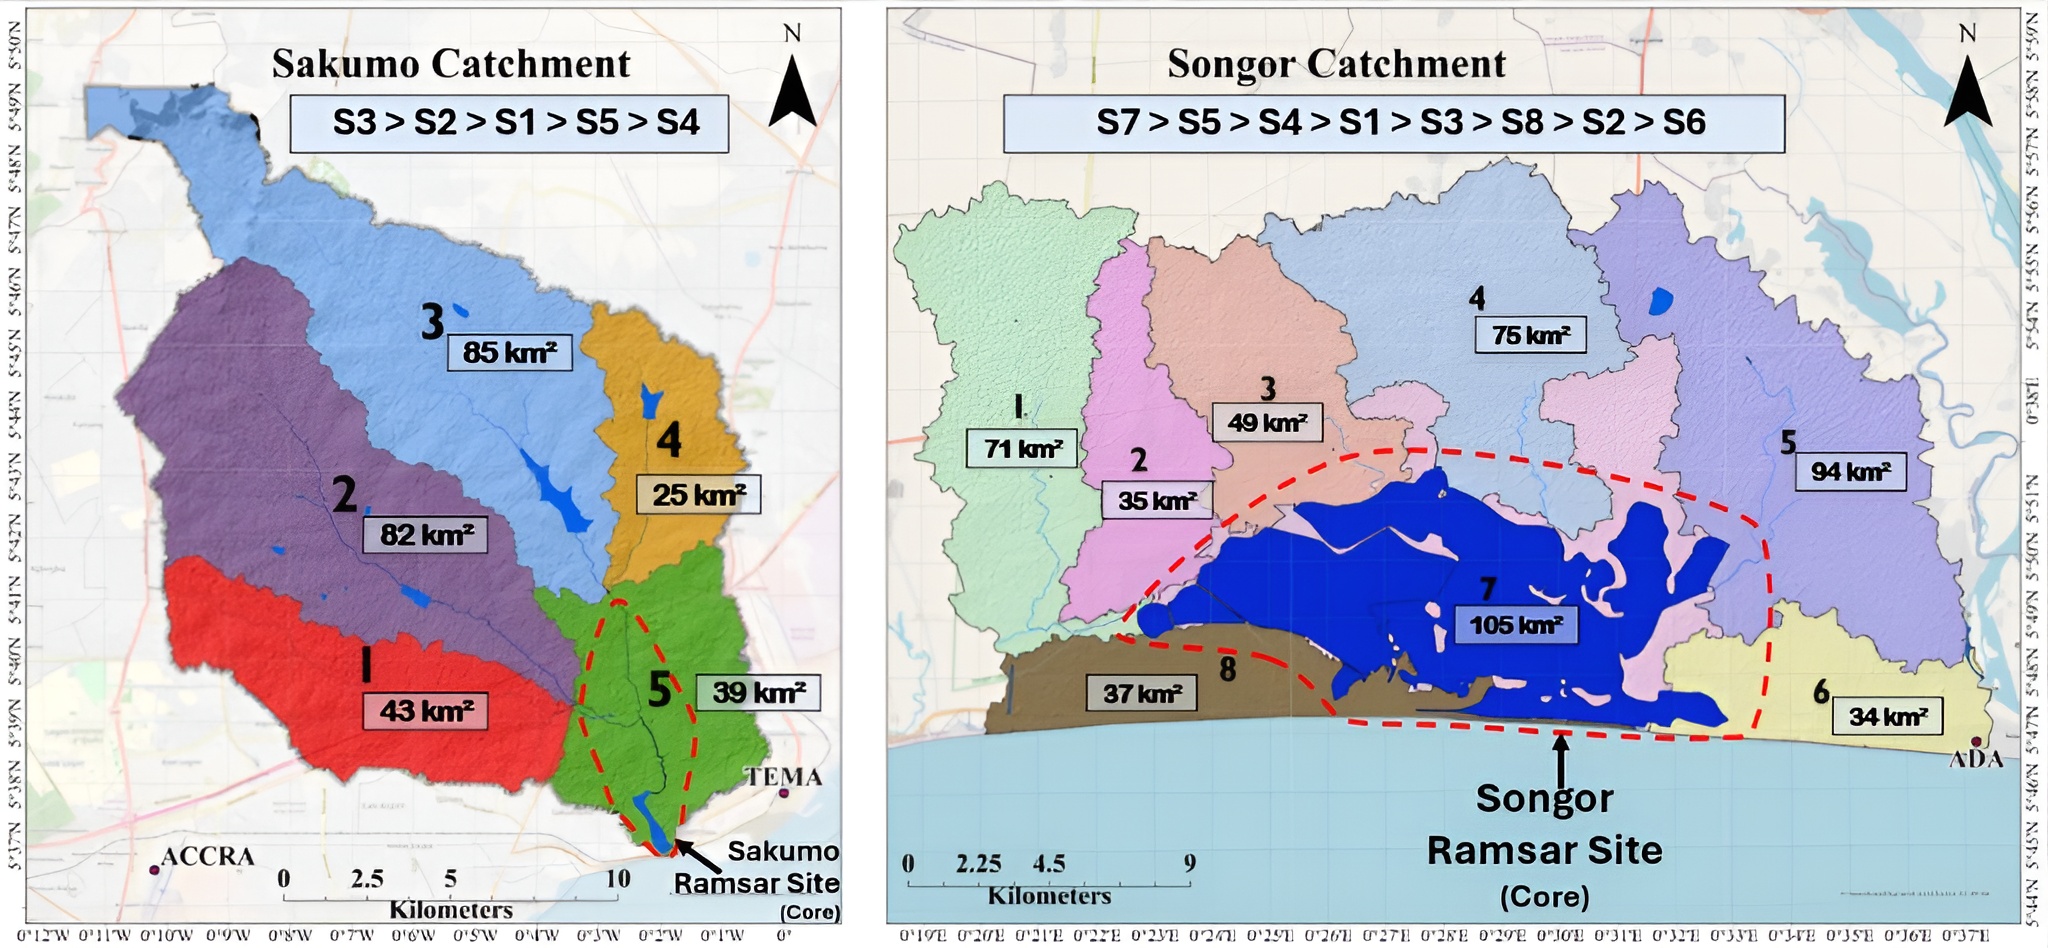
Hydrologically derived catchment boundaries delineating the contributing drainage areas of the Sakumo and Songor lagoons.
Catchments were extracted from the SRTM DEM using flow direction and accumulation modelling. These boundaries constrain the spatial extent of the land-cover analysis to areas that directly influence lagoon hydrology and wetland ecosystem condition.
Driver Attribution
Population Pressure
Population density increased steadily across both catchments between 1990 and 2020. Spatial patterns revealed emerging population

Spatial distribution of population density across the Sakumo and Songor catchments derived from LandScan, WorldPop, and GlobPOP datasets.
Temporal comparisons show progressive intensification of population clusters surrounding the wetland systems, particularly along urban corridors. These patterns indicate increasing anthropogenic pressure on wetland ecosystems and adjacent land resources.
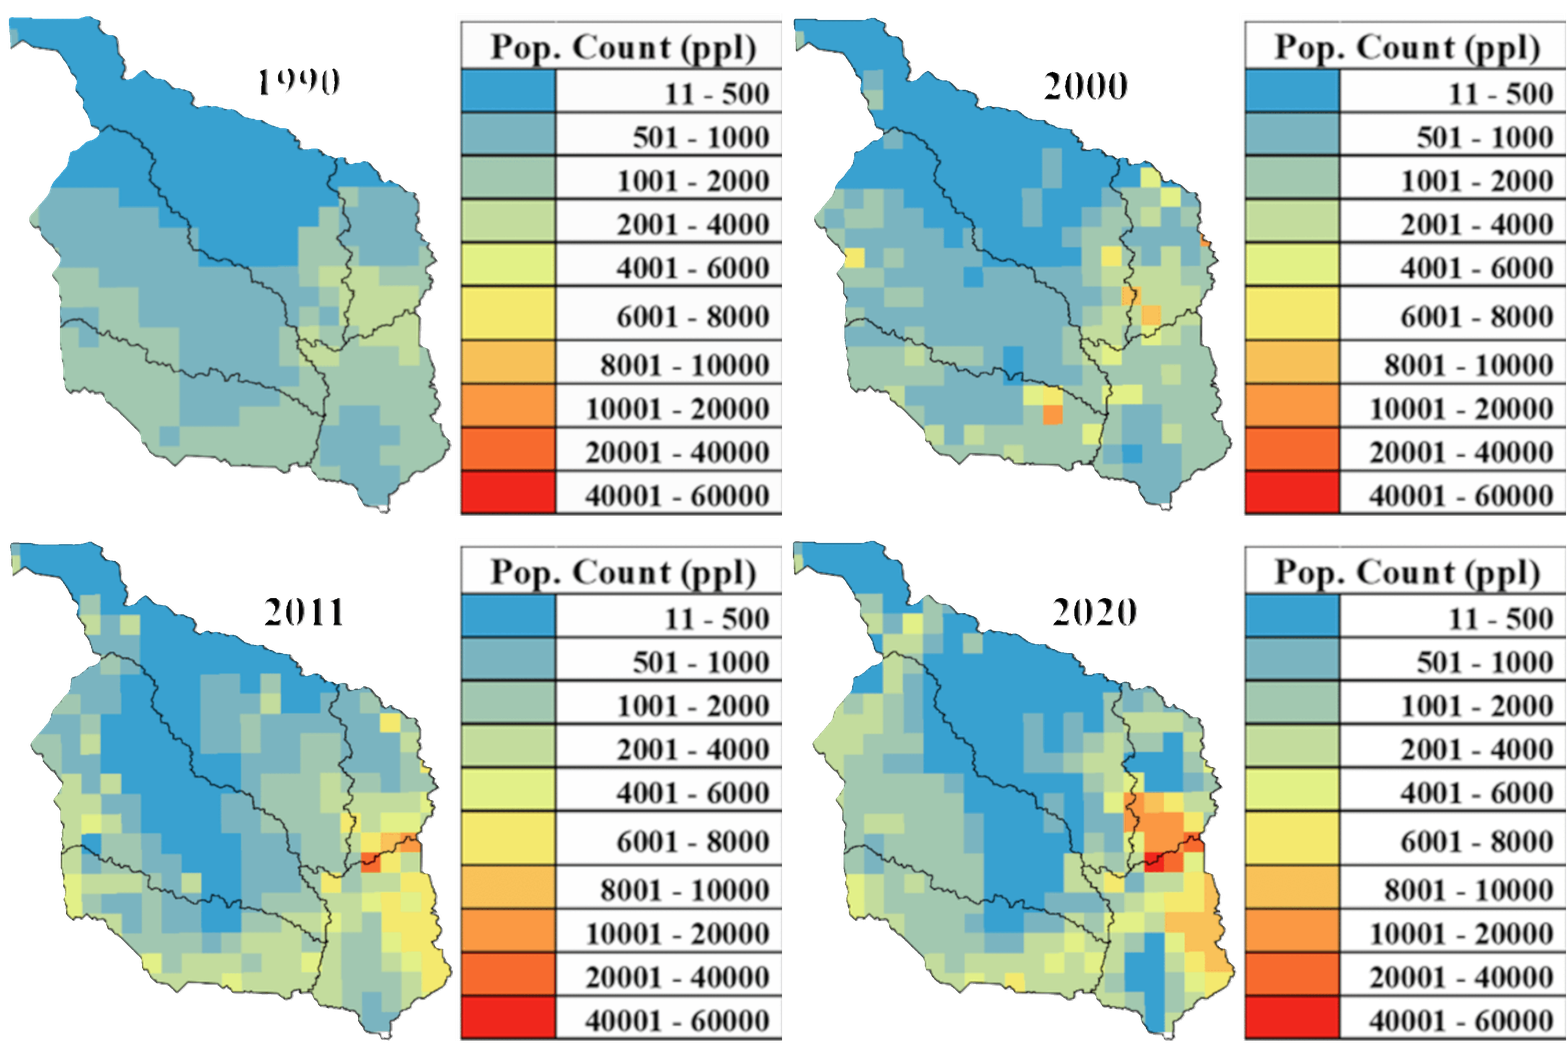
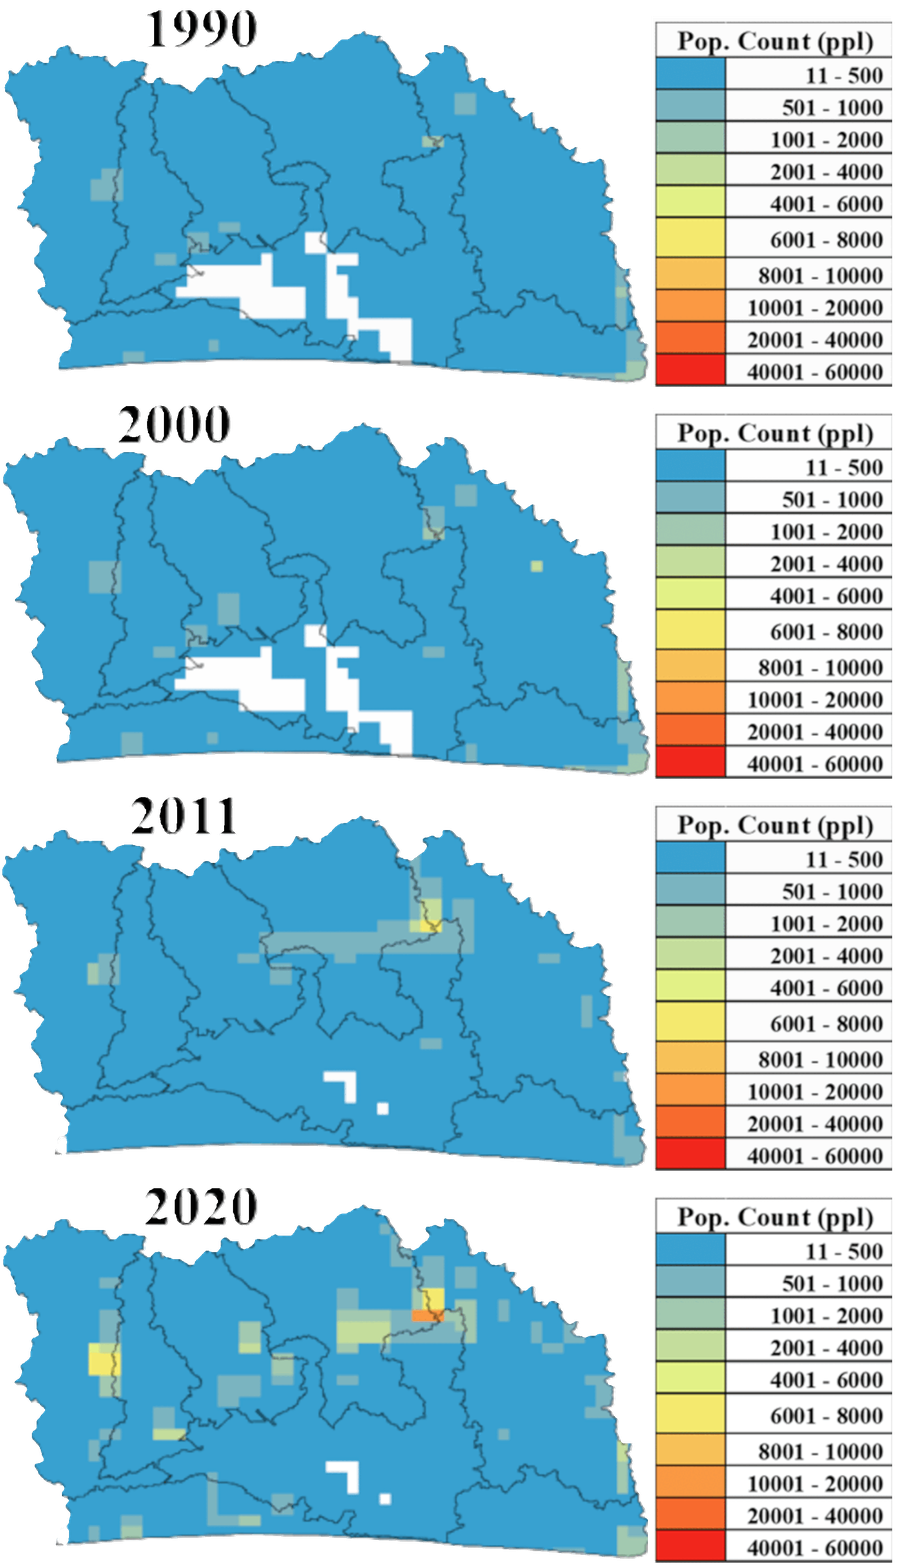
Spatiotemporal evolution of population density across the Sakumo (left) and Songor (right) catchments between 1990 and 2020.
Animated population grids reveal expanding urban clusters and increasing settlement density surrounding lagoon systems. The spatial correspondence between population growth and wetland land-cover change suggests strong human drivers of ecosystem transformation
Hydro-Climatic Trends
Hydro-climatic variability across the Sakumo and Songor catchments was evaluated using the Mann–Kendall trend test and Sen’s slope estimator, two non-parametric statistical methods widely used for detecting monotonic trends in environmental time series. The analysis examined long-term changes in precipitation, temperature, evapotranspiration, and catchment water balance between 1990 and 2020.
Results indicate that temperature exhibits a statistically significant upward trend in both catchments, while rainfall, evapotranspiration, and overall water balance show no statistically significant long-term trends.
- Temperature: Significant warming trend detected in both catchments (p < 0.05) with a Sen’s slope of approximately 0.03 °C per year, indicating gradual but persistent regional warming.
- Precipitation: Mann–Kendall results indicate weak positive trends; however, the trends are not statistically significant (p > 0.05), suggesting that rainfall variability remains largely stable over the study period.
- Evapotranspiration: Minor increases were observed but trend statistics were not significant, indicating no long-term systematic change in atmospheric water demand.
- Catchment Water Balance: Combined precipitation and evapotranspiration dynamics show no statistically significant long-term trend, indicating that large-scale hydro-climatic forcing has remained relatively stable.
The statistical results suggest that while regional warming is detectable, climate variability alone does not explain the observed wetland transformation. Instead, the spatial correspondence between land-use change and ecosystem degradation indicates that anthropogenic land transformation is the dominant driver of wetland change within the Sakumo and Songor catchments.
Hydro-Climatic Trend Test Results
Swipe horizontally to view full table →
| Variable | Sakumo Catchment | Songor Catchment | ||||||
|---|---|---|---|---|---|---|---|---|
| Tau (τ) | Sen's Slope Estimator (Q) |
Z | p-value | Tau (τ) | Sen's Slope Estimator (Q) |
Z | p-value | |
| Precipitation | 0.032 | 1.15 | 0.24 | 0.81 | 0.092 | 2.53 | 0.71 | 0.48 |
| Temperature (°C/yr) | 0.535 | 0.03 | 4.21 | 2.5e-05 | 0.518 | 0.03 | 4.08 | 4.5e-05 |
| Evapotranspiration | 0.10 | 2.55 | 0.75 | 0.45 | 0.12 | 2.53 | 0.92 | 0.36 |
| Water Balance | -0.11 | -0.83 | -0.85 | 0.40 | 0.05 | 0.61 | 0.37 | 0.71 |