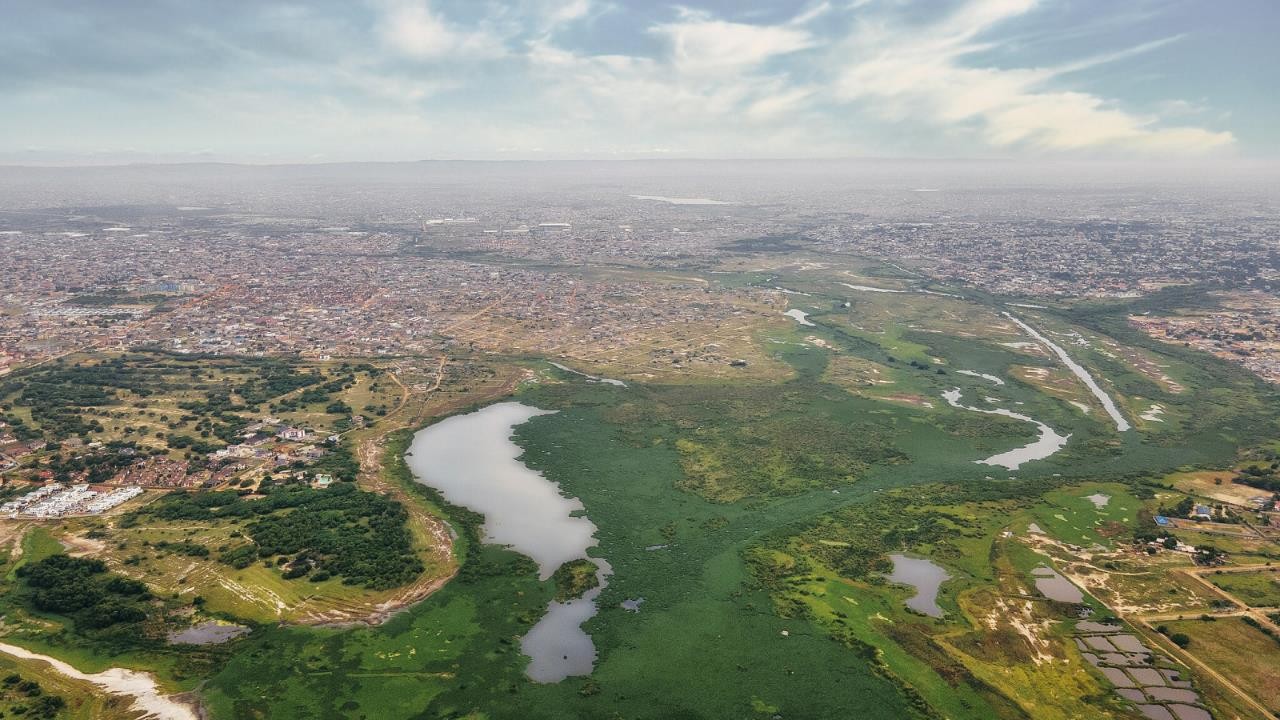
Multi-Temporal Land Use Change and Runoff Modelling in the Sakumo Catchment
Integrated geospatial analysis of 30 years of satellite data to assess land-use change, runoff dynamics, and non-point source pollution hotspots within a Ramsar-designated wetland catchment.
Hydrological Modelling • Remote Sensing • Watershed Pollution Assessment
Project Context
Rapid urbanisation within coastal wetland catchments increases runoff, nutrient loading, and ecological stress.
This project analysed 30 years of satellite imagery to quantify land-use and land-cover (LULC) change in the Sakumo Ramsar catchment in Ghana and evaluate its implications for runoff generation and non-point source pollution.
The goal was to link spatial land transformation with hydrological response and pollution hotspot formation.
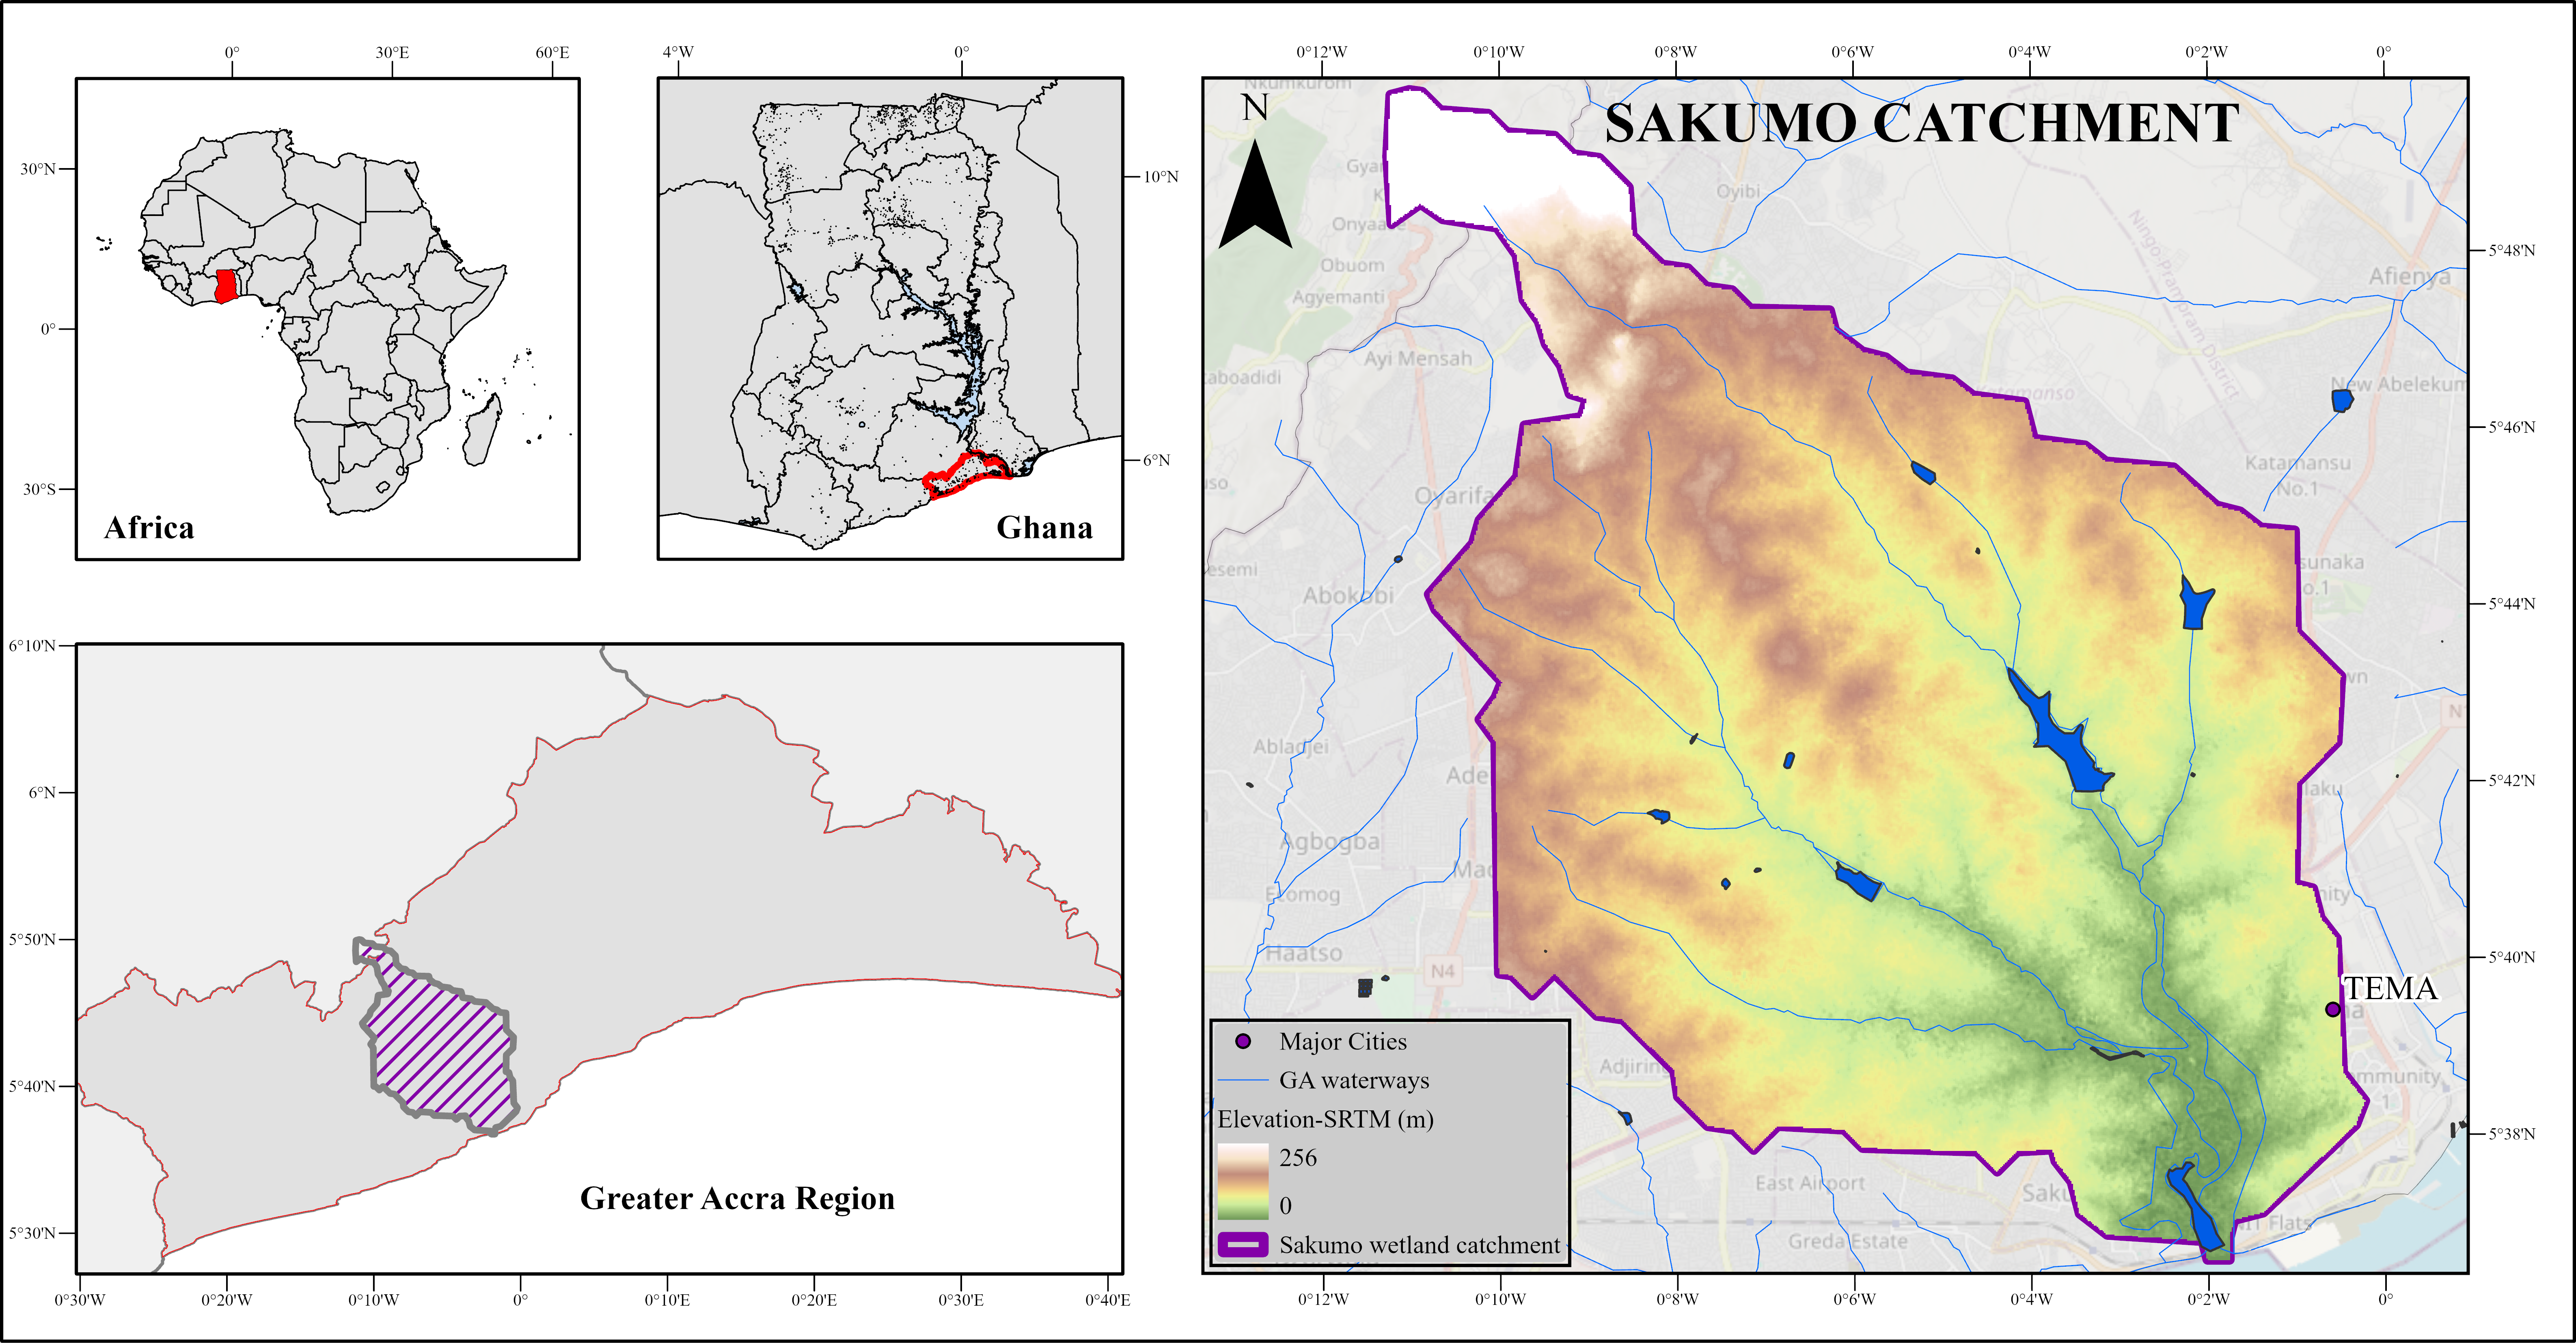
Geographic extent and drainage structure of the Sakumo Ramsar catchment.
The catchment boundary defines the hydrological domain used for runoff modelling and pollutant transport analysis. All land-use and environmental drivers influencing lagoon water quality are evaluated within this spatial unit.
Project Quick Facts
- Study Area
Sakumo Ramsar Catchment - Study Period
~30 years - Primary Data
Landsat Satellite Series - Tools
Google Earth Engine, QGIS, ArcGIS Pro - Hydrological Model
QNSPECT Watershed Model - Outputs
LULC Maps, Runoff Surfaces, Nutrient Load Maps
Analytical Framework
The workflow integrated remote sensing, GIS-based hydrological modelling, and watershed pollution assessment.
- Multi-temporal Landsat image classification
- Supervised LULC mapping across three decades
- Change detection analysis
- Runoff and flow accumulation modelling
- QNSPECT modelling of nitrogen (TN) and phosphorus (TP) loads
- Spatial hotspot analysis
Processing combined cloud-based workflows in Google Earth Engine with desktop geospatial analysis using QGIS and ArcGIS Pro.
Conceptual Workflow
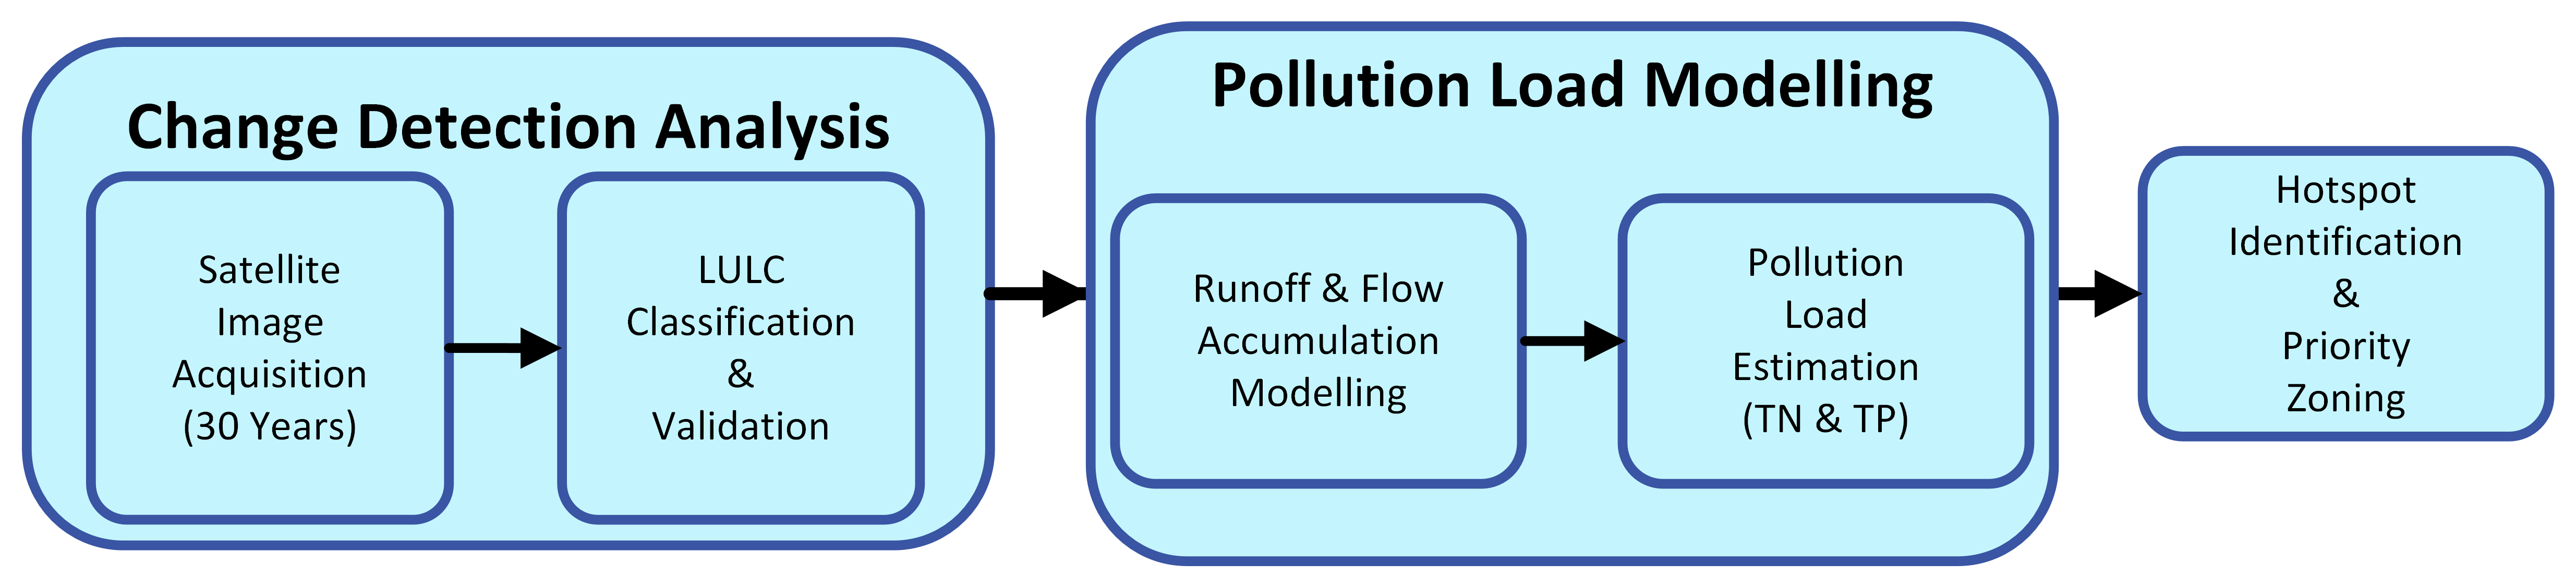
Integrated remote sensing and watershed modelling workflow.
Analytical Pipeline
Satellite Data
Landsat imagery used for multi-temporal land cover mapping
Terrain Analysis
SRTM DEM used for watershed and sub-catchment delineation
Land Use Change
Supervised classification and change detection
Hydrological Modelling
Runoff modelling incorporating precipitation and soil hydrological properties
Pollution Modelling
QNSPECT estimation of TN and TP loads and hotspot zones
Supporting Environmental Drivers
Additional datasets were analysed to understand environmental factors influencing hydrological behaviour and pollutant transport within the Sakumo catchment. These datasets provide contextual evidence supporting the observed increases in runoff and nutrient loads identified through the modelling workflow.
Population growth, terrain characteristics, soil hydrological properties, and precipitation variability all influence surface runoff generation, infiltration capacity, and the mobilisation of pollutants across the watershed.
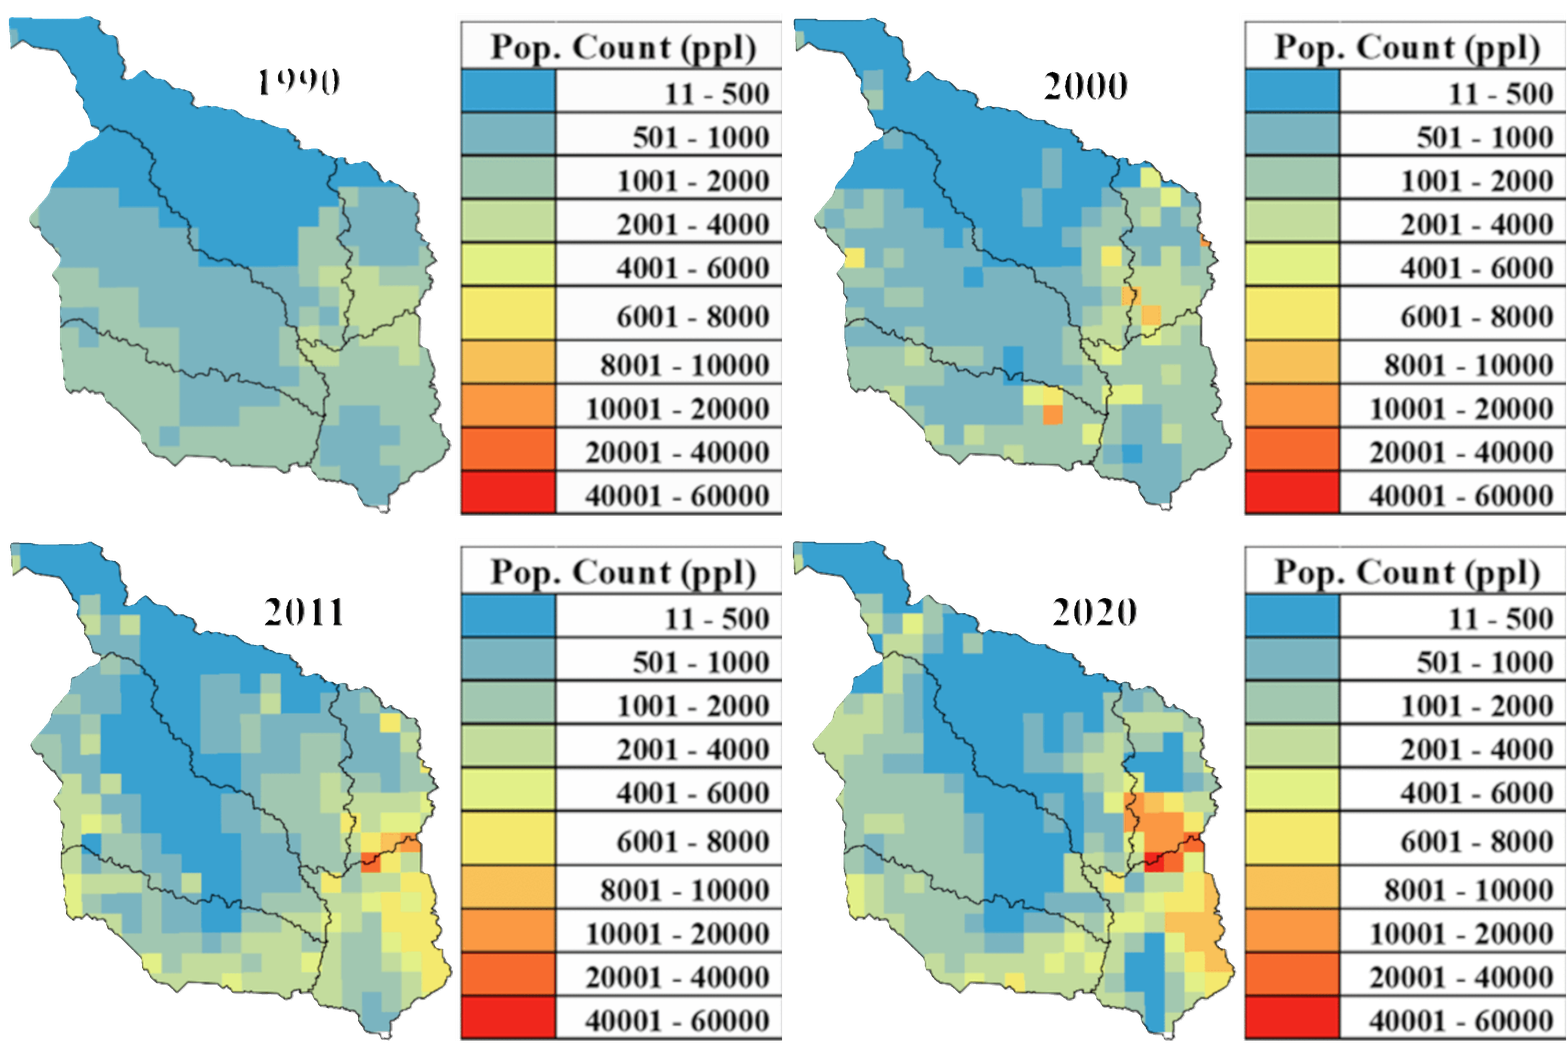
Population expansion reflects rapid urbanisation surrounding the wetland system and represents a key driver of land transformation and increasing watershed pressure.

Elevation gradients control surface runoff routing, watershed boundaries, and sub-catchment structure used in the hydrological modelling workflow.
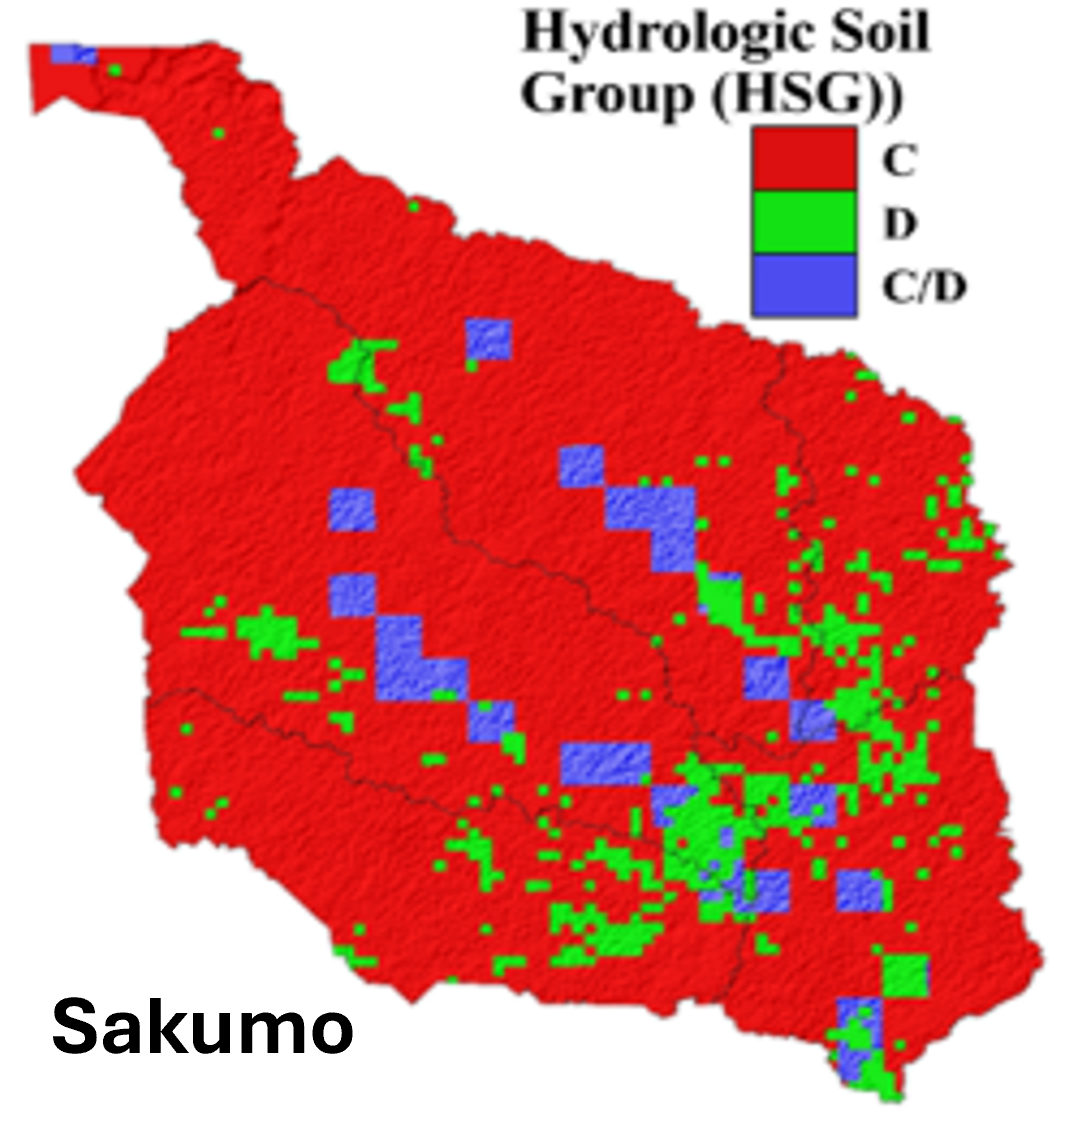
These classifications determine runoff generation rates within the QNSPECT model, with low-permeability soils contributing to higher surface runoff and pollutant transport.
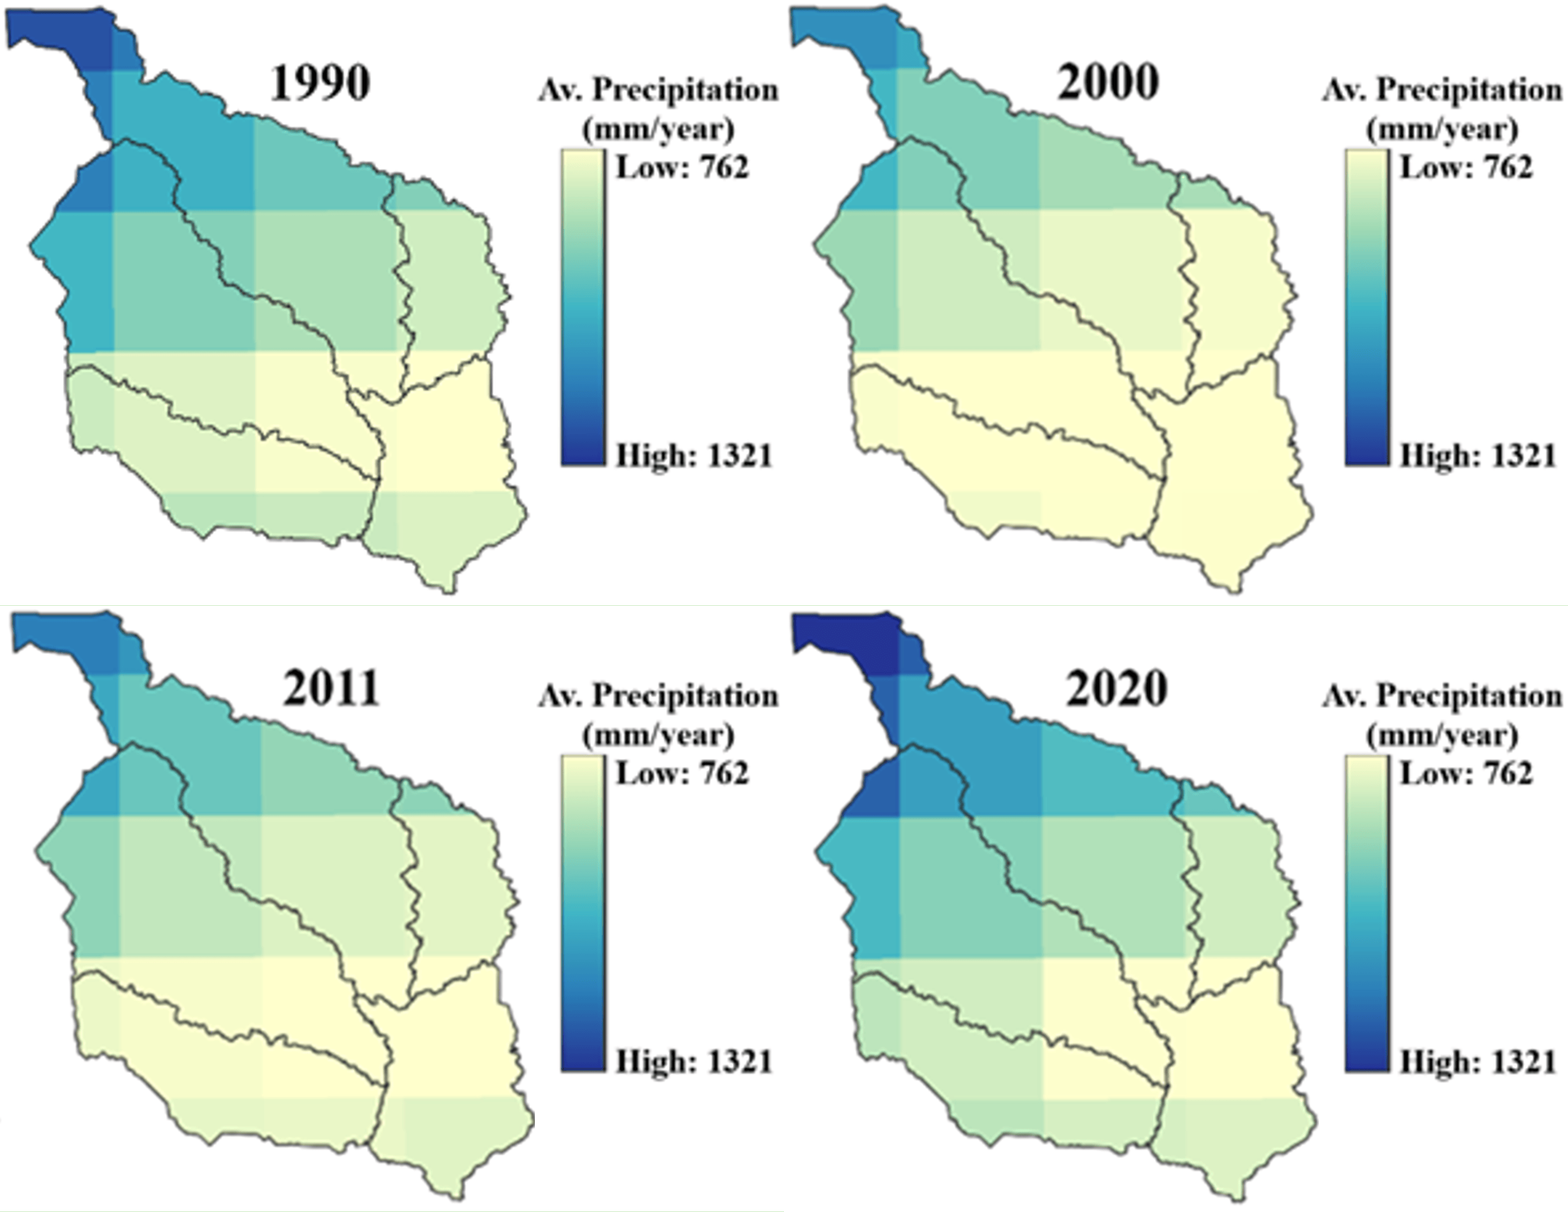
Rainfall intensity and variability influence runoff production and nutrient mobilisation across the watershed.
Land Use and Land Cover Change
Urban expansion progressively reduced natural land cover, increasing impervious surfaces within the catchment.
Multi-temporal satellite imagery was classified to map the evolution of land use across the Sakumo watershed. The results highlight rapid growth of built-up areas at the expense of vegetated and open land surfaces.
These transformations influence hydrological behaviour by reducing infiltration capacity and increasing surface runoff generation within the catchment.
A detailed description of the satellite preprocessing, classification workflow, and accuracy assessment used to generate the LULC maps is provided in the earlier project Land Use Change Detection Analysis .
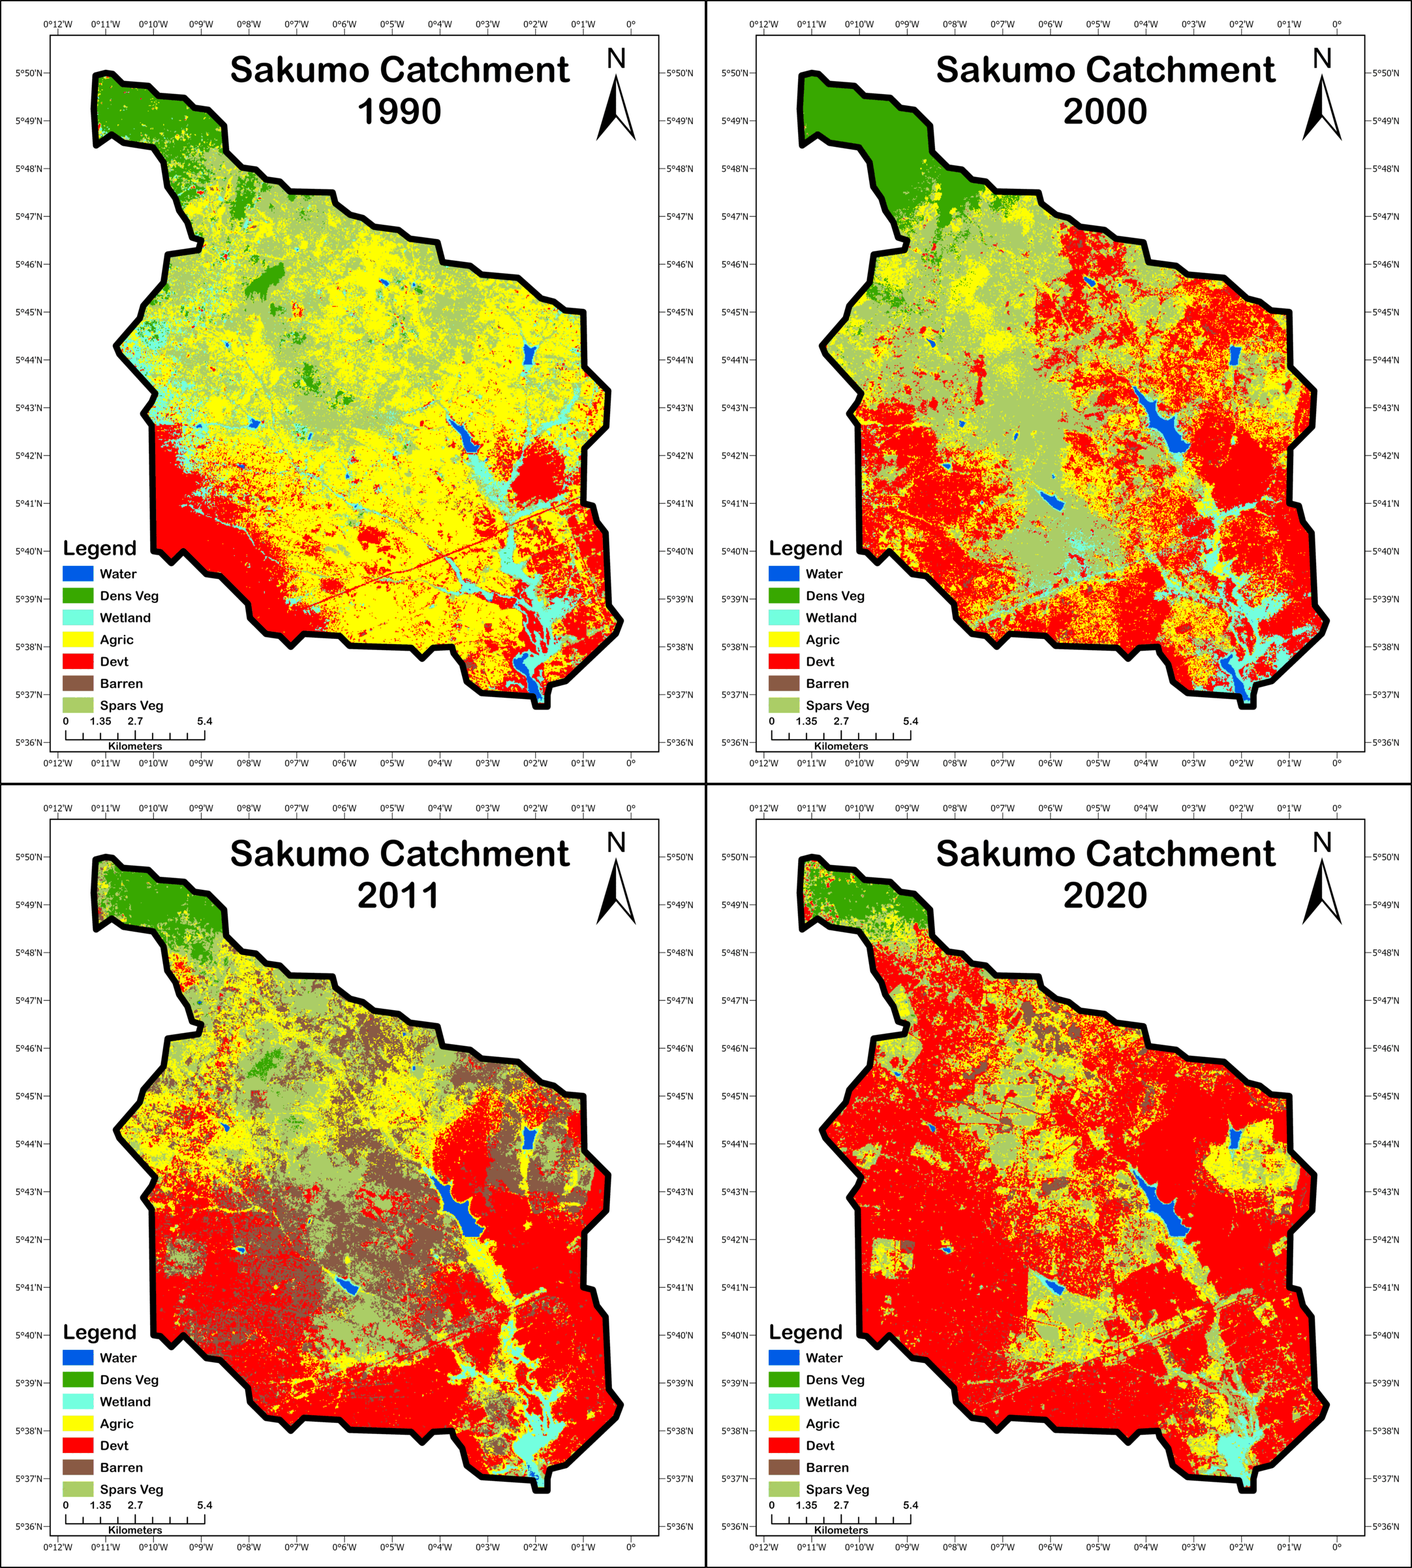
Multi-temporal land-use and land-cover evolution within the Sakumo watershed (1990–2020).
Landsat classifications reveal progressive expansion of built-up areas and decline of vegetated surfaces. These transformations reduce infiltration capacity and increase runoff generation within the catchment.
Watershed and Sub-Catchment Delineation
Hydrological analysis requires defining drainage boundaries and flow pathways within the catchment. The Sakumo watershed was delineated using elevation-derived terrain data to identify natural drainage patterns and surface runoff pathways.
A Digital Elevation Model (SRTM) was used to derive flow direction, flow accumulation, and stream networks. These layers enabled the identification of drainage outlets and the subdivision of the catchment into smaller hydrologically connected sub-catchments.
- Sink filling and DEM conditioning
- Flow direction and flow accumulation modelling
- Stream network extraction using accumulation thresholds
- Watershed outlet identification
- Subdivision into hydrologically consistent sub-catchments
These sub-catchments formed the spatial framework for runoff modelling and estimation of non-point source pollution loads within the QNSPECT watershed model.
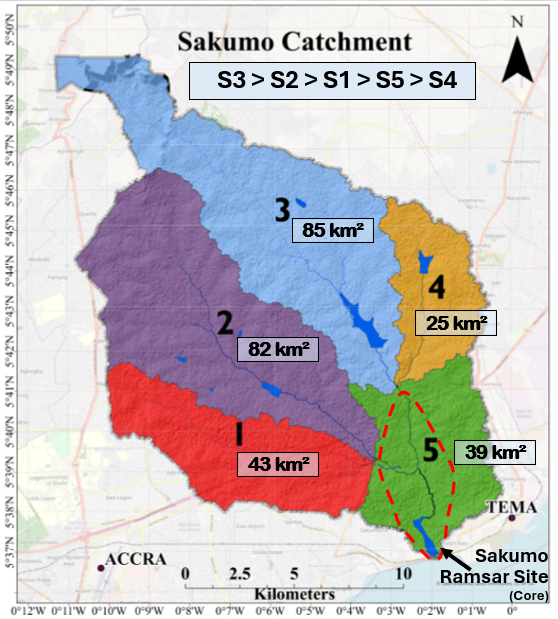
Hydrologically derived sub-catchments used as modelling units in the QNSPECT watershed analysis.
Sub-catchments were delineated from the DEM using flow direction and accumulation modelling to represent discrete drainage units contributing runoff and nutrient loads to the lagoon.
Runoff and Hydrological Response
Urban expansion progressively reduced natural land cover and increased impervious surfaces within the catchment. The land transformations altered hydrological response patterns, increasing runoff generation and downstream flow accumulation.
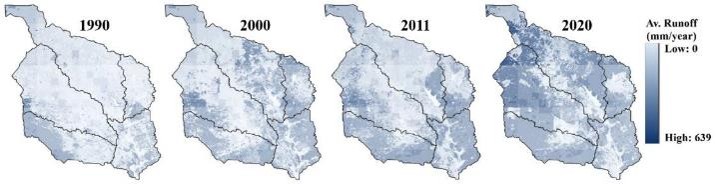
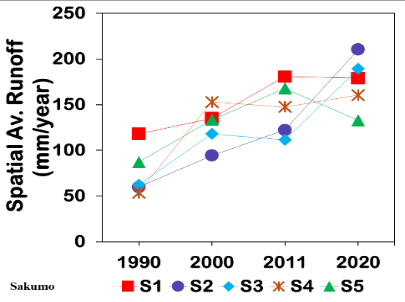
Spatial distribution (left) and temporal trends (right) of modelled surface runoff across the Sakumo watershed.
Runoff intensity increases in urbanised portions of the catchment where impervious surfaces dominate, demonstrating the hydrological consequences of land-use transformation.
Nutrient Loading Hotspots
Total nitrogen (TN) and total phosphorus (TP) concentrations were spatially clustered in rapidly urbanising sub-catchments.
The spatial patterns highlight sub-catchments where land-use transformation is directly influencing downstream water quality. These zones represent priority areas for watershed management and pollution mitigation strategies.
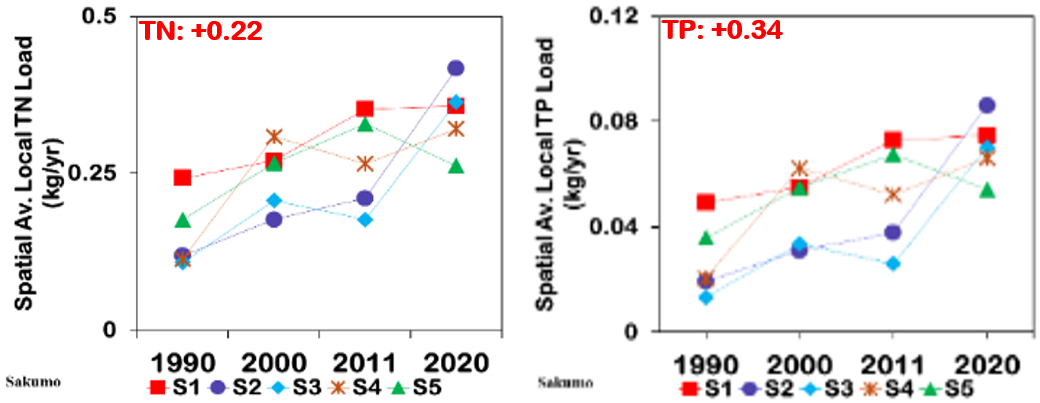
The results indicate increasing nutrient delivery to downstream wetland systems, corresponding with intensified land development and increased runoff generation.
Nutrient Loading Hotspots
Spatial modelling identified distinct hotspots of nutrient loading within rapidly urbanising portions of the catchment. Areas with high impervious surface coverage exhibited elevated nitrogen and phosphorus export due to increased surface runoff.
The spatial patterns highlight sub-catchments where land-use transformation is directly influencing downstream water quality. These zones represent priority areas for watershed management and pollution mitigation strategies.
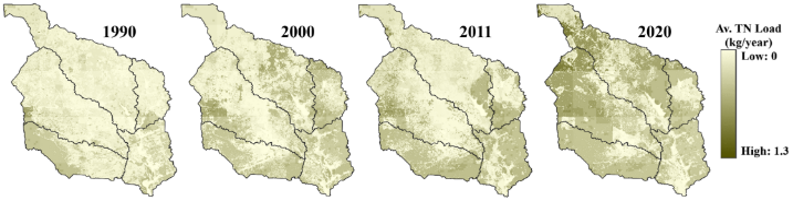
Elevated nitrogen loads are concentrated in rapidly urbanising drainage areas where runoff mobilisation is highest.
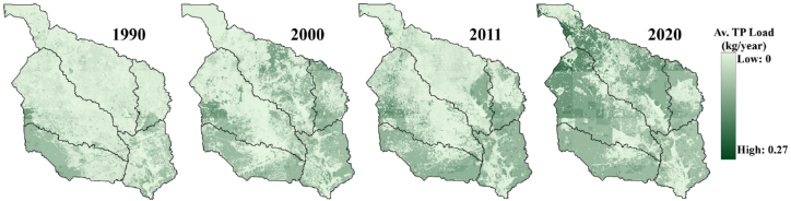
High phosphorus export zones correspond with areas of dense urban development and agricultural activity.
Literature-Based Water Quality Interpretation
Observed increases in simulated nitrogen and phosphorus loads are consistent with historical water quality observations reported in previous studies of the Sakumo Ramsar site. Monitoring records indicate increasing nutrient concentrations and declining water quality conditions within the wetland ecosystem.
The temporal distribution of accumulated runoff and total phosphorus in sub-catchment 5 (S5) aligns with these reported trends, suggesting that land-use transformation and urban expansion are contributing to increased nutrient delivery to the wetland system and potential eutrophication risks.
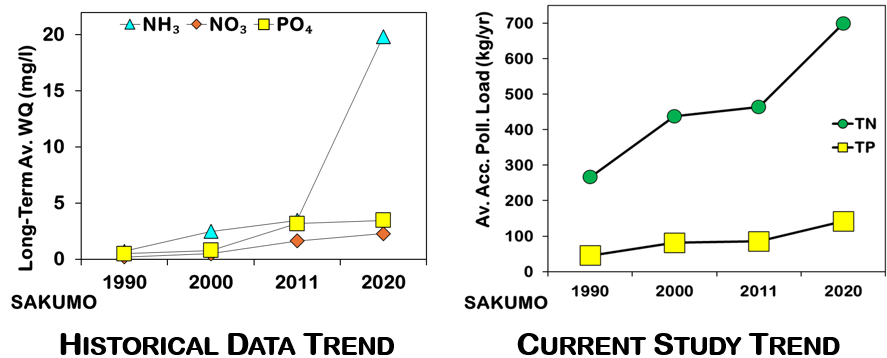
Historical and contemporary trends in water quality indicators within the Sakumo Ramsar wetland system.
Observed increases in nutrient concentrations align with modelled runoff and nutrient export patterns, supporting the interpretation that watershed urbanisation is contributing to declining wetland water quality.
Environmental and Management Relevance
The results provide spatial evidence supporting improved wetland catchment management and water quality protection.
- Catchment-scale water quality management
- Wetland conservation planning
- Urban expansion monitoring
- Nutrient load mitigation strategies
Professional Relevance
This project demonstrates capability in:
- Multi-temporal remote sensing analysis
- Hydrological modelling linked to land transformation
- Integration of cloud and desktop GIS workflows
- Translating spatial analysis into environmental decision support